Patterns in Live Event Wagering Adjustments Based on Real-Time Statistical Updates in Soccer Matches
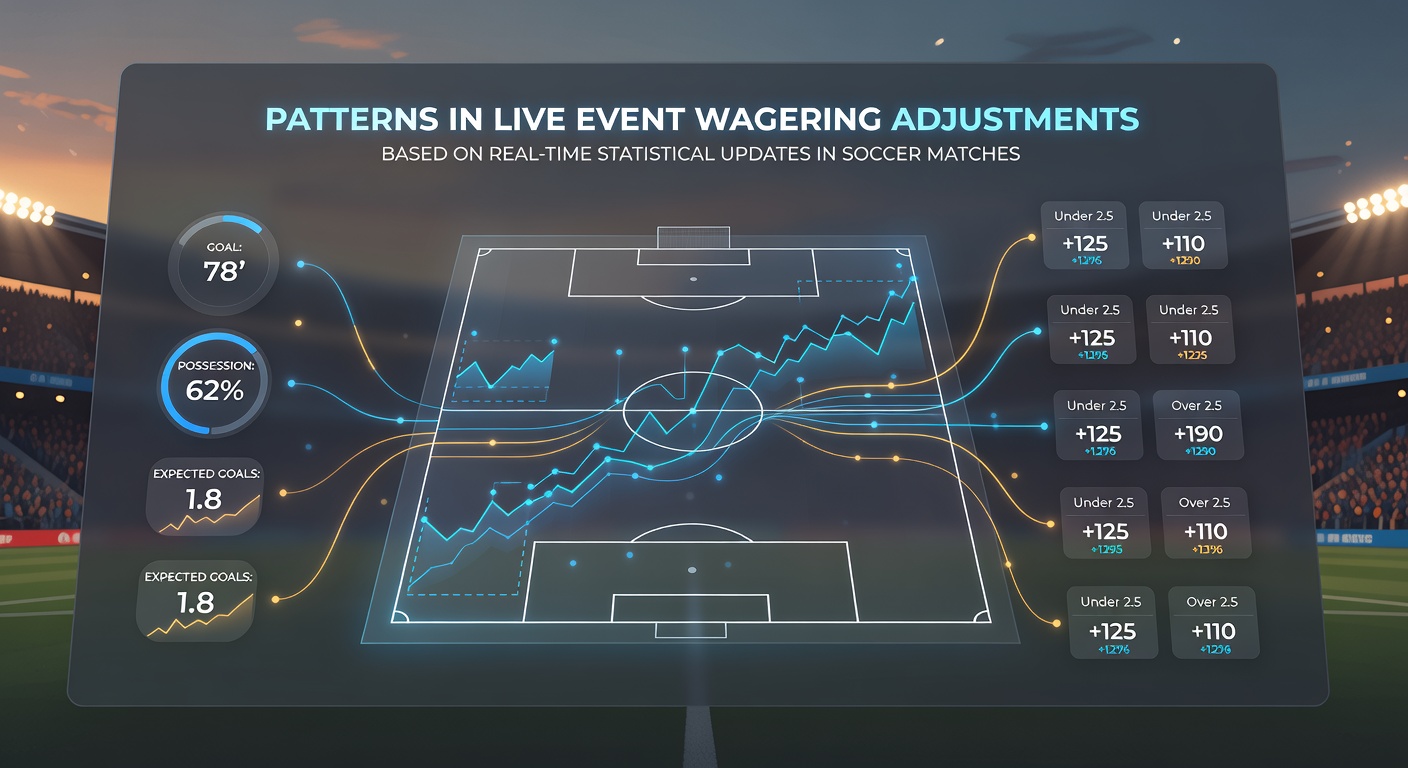
Live event wagering in soccer responds directly to incoming data streams that include possession percentages, shot accuracy, expected goals metrics, and player substitution details, and operators adjust odds in seconds when these figures deviate from pre-match projections. Analysts track how markets shift after each significant update because even small changes in ball recovery rates or set-piece conversion data can alter the implied probabilities that determine current prices.
Statistical Inputs That Trigger Immediate Market Movements
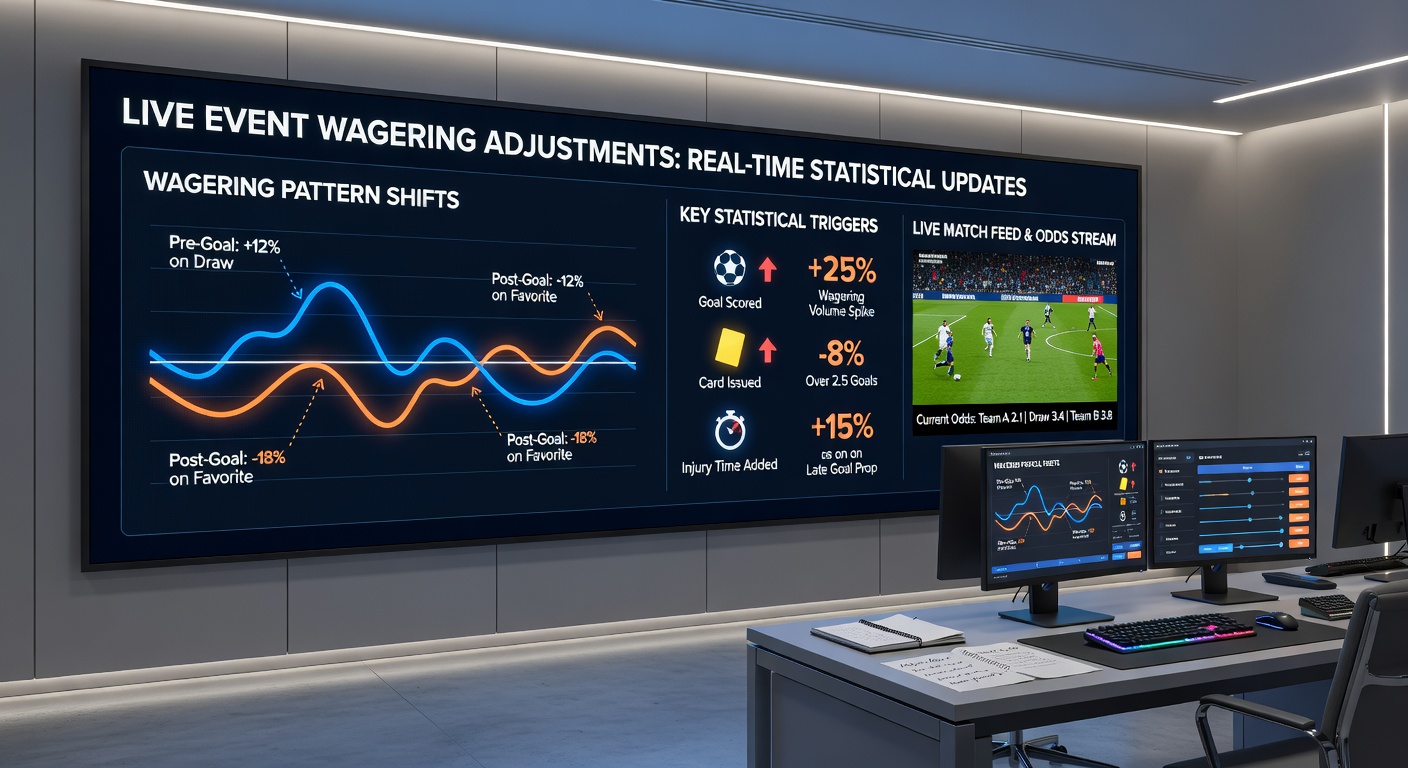
Real-time feeds deliver updates on metrics such as progressive passes completed and high-intensity runs, which betting platforms convert into revised probabilities while the match continues. Observers note that when a team’s expected goals value rises sharply after a sequence of sustained attacks, live odds on that side scoring next tighten within the same minute. Data shows these adjustments occur most frequently in the middle third of matches because cumulative statistics reach thresholds that algorithms flag as meaningful.
Red cards and injuries produce the largest single-step changes because they instantly reduce a team’s projected output for the remaining time. Researchers have documented that markets widen spreads by several percentage points in the minutes following such events, while volume spikes as participants react to the new information. In May 2026 matches across major European leagues, platforms recorded average adjustment intervals of under four seconds when official match data services confirmed a dismissal.
Observable Patterns Across Different Match Phases
Early adjustments often reflect possession dominance rather than goal threat, whereas later stages see sharper reactions to shot location and quality data. One study of over 2,000 fixtures found that live markets moved more than 15 percent of the time when a side exceeded 60 percent territory in the final 20 minutes, compared with only 8 percent movement for similar dominance in the opening quarter. Those who monitor these sequences report that halftime statistical resets create distinct second-half pricing behavior because models recalibrate baseline expectations.
Corner and throw-in counts also generate secondary patterns, especially when they cluster in dangerous areas near the box. Figures reveal that platforms widen under/over lines on corners within 10 seconds of a team winning its fifth set piece in a 15-minute window. The same datasets indicate that teams trailing by one goal show accelerated odds compression on next-goal markets once their shot attempts per 10 minutes exceed the opponent’s rate by a factor of 1.8.
Technology and Data Latency Considerations
Low-latency APIs connect official match data providers to betting engines, yet even brief delays in transmission can create temporary discrepancies between actual events and displayed prices. Industry reports note that operators using multiple redundant feeds reduce such gaps to under one second in most cases. When a single feed experiences congestion, markets sometimes freeze temporarily to prevent execution against stale probabilities.
Automated systems apply machine-learning layers that weigh recent statistical trends against historical match contexts, which produces smoother adjustments than older rule-based models. According to research published by the European Gaming and Betting Association, these hybrid approaches lowered the incidence of extreme price jumps by 22 percent during the 2025-2026 season. EGBA publications further detail how real-time calibration improves when models incorporate both raw event data and derived metrics such as expected threat.
Regional Variations in Adjustment Frequency
European domestic leagues generate higher volumes of statistical updates per minute than many other competitions because match officials supply more granular event tagging. In contrast, certain South American tournaments show slightly longer average adjustment intervals, partly due to differences in data provider coverage. Observers note that markets in Asian time zones often experience secondary waves of movement when European late-evening fixtures release updated xG values after the 70-minute mark.
Regulatory frameworks in several jurisdictions require operators to maintain audit logs of all live price changes, which allows external reviewers to verify that adjustments align with published statistical inputs. The Ontario Lottery and Gaming Corporation publishes periodic summaries of compliance metrics that include latency benchmarks for sports betting platforms operating under its oversight.
Conclusion
Patterns in live soccer wagering continue to evolve alongside improvements in data granularity and processing speed, and the relationship between statistical updates and price movements remains measurable across thousands of matches each season. Platforms that integrate multiple verified feeds demonstrate more consistent alignment between events and odds, while participants who follow these documented sequences gain clearer visibility into the timing of typical adjustments. As match data services expand their coverage, the precision of real-time recalibrations is expected to increase further without altering the fundamental link between on-field metrics and market responses.